The Bowery Capital team has spent the past year going deep on B2B marketplaces and interviewing leading founders and investors to learn what it takes to build success in the B2B marketplace arena. As the current generation of B2B marketplaces begin to go public, we will use these opportunities to analyze their businesses at a more granular level. Today, we take a look at ACV Auctions recent S-1 filing.
ACV is one of the first of this generation’s B2B marketplaces to go public and its S-1 is a unique chance to look ‘under the hood’ at the economics of a vertical marketplace that has achieved public company scale. We first interviewed ACV co-founders Dan Magnuszewski and Joe Neiman last summer for our B2B marketplace series and have been excited to see the company take this next step in its evolution. Given Bowery’s focus on B2B marketplaces, we wanted to take a deeper look at ACV’s S-1 filing and share some of our perspective.
The Bottom Line
- ACV’s IPO supports the theory that many of today’s vertical B2B marketplaces can reach public company scale and will not need to seek an exit through acquisition. The company’s S-1 provides a useful roadmap for B2B marketplace founders trying to understand the scale and market opportunity needed to IPO.
- ACV tripled revenue 2018 -> 2019 and then doubled it from 2019 -> 2020; GMV also followed this 3x -> 2x YoY growth pattern. ACV’s ability to scale revenues from $35MM to $208MM in only two years - and the promise of more growth to come - is what has enabled the company to take the IPO route.
- ACV generates ~$6 in revenue for every $100 transacted on its platform; this 6% effective take rate is a good guidepost for founders when they think about what degree of monetization the public markets will look for. ACV’s revenues come from auction fees, transportation, and assurance, all of which have very different margins - another variable for founders to think about as they try to build out value added service opportunities.
- ACV’s projected $3B valuation at the offering is a roughly 15x revenue multiple - this is slightly lower than today’s average SaaS multiples of ~ 20x. However, ACV’s multiple will likely rise after a post-IPO ‘pop’. In the long run, ACV’s multiple will help indicate where vertical B2B marketplaces can be expected to trade in terms of valuation.
- While the S-1 doesn’t make any forward looking projections, it’s clear investors expect ACV’s revenues to continue on this upwards trajectory as it captures more share of the wholesale auto market and leverages this growth to launch new monetization streams.
The Company
ACV Auctions is a digital marketplace designed for the wholesale transaction of automobiles. Since its inception in 2015, Buffalo-based ACV has facilitated over 750K transactions for 21K dealers and commercial partners. Its users consist of independent and franchise used car dealers on the demand side, as well as commercial partners which provide much of the supply, including rental car companies, off-lease programs, repossessions, and fleet programs.
ACV By the Numbers

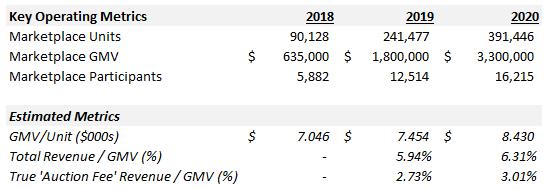
ACV reported over $3.3B in Gross Merchandise Value (GMV) being transacted on their platform during 2020. This $3.3B in GMV was generated by 391K transactions involving a total of ~16k marketplace participants (this works out to an AOV of ~$8,500). ACV’s rise is remarkable given that it was only doing $22MM in GMV for all of 2016. Today, ACV serves 125 territories in the US and is planning near-term expansion in both the US and Canada.
2020 was a breakout year for ACV, with GMV growing 86% and the total number of unique transactions up 62%. 2020 also saw ACV’s GMV grow 2x as fast as the number of marketplace participants, signaling expansion among ACV’s existing user base.
In discussing its business model, ACV highlights its ability to provide “unbiased accuracy and transparency” for its marketplace participants. By positioning itself as a neutral arbiter of vehicle quality, ACV adds value to its marketplace beyond simply being a venue for matching buyers with sellers. ACV employees inspect every car before it can be listed on the marketplace utilizing a proprietary assessment which evaluates “100 details such as cosmetic irregularities, as well as structural assessments that identify prior repairs or damages,” and the company has over 700 vehicle condition inspectors on staff who make this quality assurance possible.
ACV has also gotten creative with the kinds of tools it can give bidders who want to do their own inspecting, rolling out Virtual Lift, which uses a specially-designed camera to offer “a high definition look at a vehicle’s undercarriage without having to put it up on a lift,” and Audio Motor Profile, which features “clear recording and immediate sharing of a vehicle’s engine sound.” These features give dealers bidding at home some of the value of an in-person viewing without the accompanying hassle.
ACV’s Massive Market Potential
ACV has built a B2B marketplace in a vertical with the potential for massive scale. In the US wholesale market, 22 million used vehicles are transacted annually, accounting for $230B in annual sales, with 50% of these sales utilizing an auction format. ACV is currently only capturing a sliver of that potential opportunity (e.g., 391K units in 2020). In its S-1, ACV estimates a TAM of over $10B for the US wholesale market and cites plans for international expansion.
The wholesale automotive market is highly fragmented on both the supply and demand side, an environment which lends itself well to a marketplace model. There are more than 50,000 independent and franchise dealers in the US wholesale market and the top 100 used vehicle dealers account for less than 10% of the market’s activity. This fragmentation is reflected in ACV’s user base; in 2020, the largest seller accounted for less than 0.6% of the vehicles transacted.
The Value Added Services Playbook
ACV is following a common playbook of creating an initial B2B marketplace and then bolting on value added services as that marketplace matures. These features and services are crucial in driving non-take rate revenue. From the S-1: “We generate revenue from auction fees charged to customers for transacting on our digital marketplace and we also generate revenue from the sale of value-added and data services such as ACV Transportation, ACV Capital, Go Green assurance, and True360 reports.”
- ACV Transportation: This fulfillment offering allows buyers to pay a distance-based fee to have vehicles delivered to their dealership. ACV partners with third-party transportation companies to complete these deliveries. This accounted for ~ $70MM in 2020 revenue.
- Go Green: ACV offers an assurance service known as Go Green which is priced at a fixed rate per vehicle. From the S-1: “We provide the seller with an assurance against claims related to defects in the vehicle that we did not identify in our condition report and otherwise may have exposed the seller to loss as a result of arbitration with the buyer.” This accounted for ~ $35MM in 2020 revenue.
- ACV Capital: ACV has a financing arm that offers short-term purchase financing to buyers. The fees charged vary based on the amount and term of the financing provided. This is a relatively new business line and revenues derived from ACV Capital are currently deemed immaterial.
- Data Services: In addition to the vehicle condition reports required to list on ACV, the company is also now selling advanced car condition and history reports (True360) to help dealers with buying decisions. This is a relatively new business line and revenues derived from it are currently deemed immaterial.
By embedding itself into every step of a transaction, ACV believes it can deepen its relationship with its market participants and improve the way wholesale cars are sold. A graphic from the S-1 which is included below outlines ACV’s vision for this wider ecosystem.
ACV Platform Graphic from S-1
Positioning and Competitive Advantages
ACV has achieved an elusive goal that many B2B marketplaces chase - it has created a market and process flow that materially improves upon how goods are transacted when compared with legacy practices. Transacting on ACV reduces time wasted and costs incurred for both buyers and sellers under today’s largely in-person auction model. For buyers, this includes search costs and time spent at the auction itself; and for sellers, they stand to save on the hard costs of transporting a car to auction, as well as the opportunity costs incurred by removing that car from a dealer showroom and missing out on a potential sale. ACV is positioning itself as a platform that offers unbiased inspections and an efficient channel for sourcing and selling inventory, as well as a provider of data-driven pricing insights. ACV’s ecosystem is ultimately designed to offer a holistic solution for everything from financing to purchasing to post-sale transport.
Like many marketplaces, ACV cites network effects as a source of competitive advantage. As more buyers and sellers join the platform, liquidity and selection increases, which improves user experience and brings even more participants on board, and the transaction data ACV accumulates as the marketplace matures will allow it to further improve the participant experience and drive even more platform traffic.
ACV Network Effect Graphic from S-1
ACV’s Revenue Streams
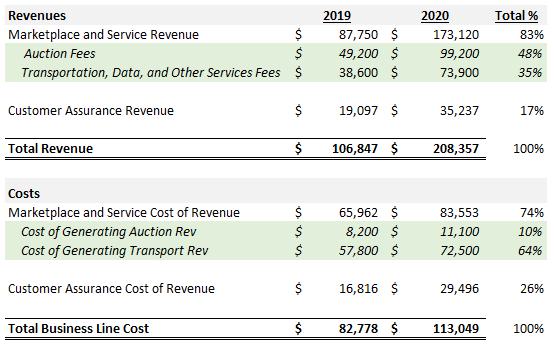
ACV reported $208MM in revenue during 2020 - a 95% YoY improvement on 2019 ($107MM), which was itself a 205% YoY improvement on 2018 ($35MM). ACV’s core revenue segment - which is reported as ‘Marketplace and Service Revenue’ - accounted for $170MM in sales (83% of 2020’s total). This revenue segment can be divided into two sub-segments, ‘Auction Fees’ and ‘Transportation, Data, and Other Services Fees.’
- Auction Fees - these fees accounted for $99MM in 2020 revenue. This is revenue primarily generated from transaction commissions and listing fees.
- Transportation, Data, and Other Services Fees - these fees accounted for $74MM in 2020 revenue. This is revenue generated primarily from transportation fees charged to buyers to ship them their purchased vehicle(s). This revenue sub-segment is lower margin than Auction Fees, as most of it is paid out to third-party transportation partners who deliver the vehicles on ACV’s behalf (this is evidenced by the $72MM in transportation-related expenses ACV incurred in 2020).
ACV’s other top-level revenue segment was Assurance Fees, which accounted for $35MM (17% of 2020’s revenues). A table outlining ACV’s core revenue components and their associated operating expenses can be found below.
ACV Segment Revenues and Costs

In 2019 and 2020, more than 50% of ACV’s revenue was derived from two lower margin revenue segments, Assurance ($35MM in 2020 revenue at a 16% gross margin) and Transportation, Data, and Other ($73MM in 2020 revenue at a 2% gross margin). However, margins on ACV’s $99MM in Auction Fees were very strong (~90%), showing the potential of the marketplace business model. The existence of these lower margin business lines can help get supply/demand onto ACV’s core marketplace by making transacting more convenient for buyers and less risky for sellers.
ACV Margin Breakdown by Business Line
Looking at its GMV and revenue totals, ACV converted roughly 6% of GMV into revenue in both 2019 and 2020. This conversion rate should grow as more business lines are bolted on (e.g., ACV Capital). If we back out the Assurance and Transportation revenues, ACV is currently converting about 3% of GMV into its core ‘Auction Fee’ revenue ($99MM / $3.3B).
In a given auction, ACV generates revenue on both sides of the transaction, charging sellers a flat fee to list their ACV-inspected vehicle on the platform, and charging buyers a commission fee on their purchase. ACV’s fees are only payable on the completion of a successful auction, making listing a low-risk proposition for sellers looking for new sales channels. While modernizing the wholesale auto market, ACV has stuck to its auction roots and cars sold on ACV are transacted through 20-minute live auctions which are typically pre-advertised on the platform. We also know ACV generates an average of $494 in total fees per transaction, per its S-1. These $494 in total fees divided by ACV's average order value of ~$8,500 works out to a roughly 6% implied take rate.
GMV and Operating Metrics

Path to Profitability
As revenues have surged, ACV has shown narrowing losses in the last two years, reporting a loss of ($77MM) in 2019 and ($41MM) in 2020. ACV is following a territory-by-territory geographic expansion plan to onboard dealers and build out an inspection function for each new geography it enters. ACV’s unit economics improve in a given geography as the area matures; these improved economics are key to ACV’s long-term path to profitability. From the S-1: “As our territories reach greater scale and higher levels of network density, we typically achieve lower inspection costs per vehicle and improved overall economics per transaction.”
Improving cohort economics can also be seen in the S-1’s discussion of how ACV’s cohorts evolve over time: “For example, sellers in our 2017 cohort sold an average of 21 vehicles in 2017. The sellers that continued to remain on our platform sold an increasing number of vehicles in subsequent years, selling an average of 79 vehicles in 2018, 112 vehicles in 2019, and 123 vehicles in 2020. We observe a similar trend with our buyers. Buyers in our 2017 cohort purchased an average of 15 vehicles in 2017 compared to 39 in 2018, 55 in 2019, and 57 vehicles in 2020. We look at such increases in buyer and seller engagement as an indicator of the strength of our marketplace and improving customer satisfaction.”
ACV Shareholders & Offering Details
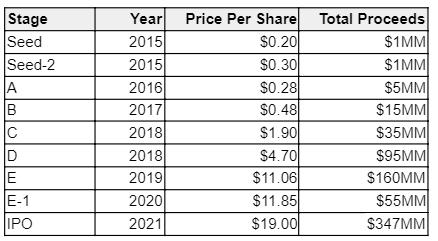
ACV’s IPO is priced to debut at between $20 and $22 per share and it seeks to raise approximately $347MM from investors, which will result in net proceeds to ACV of $321MM. ACV’s implied valuation from the planned IPO is ~$3.2B (154M shares outstanding x $21 per share).
This offering will implement a dual-class share structure with ACV’s Class B shares being granted 10 votes per share and Class A shares being apportioned only a single vote. ACV’s Class B shares are those held by the existing shareholders; while the Class A shares are the 16,550,000 at issue in this offering.
Post-IPO Capitalization

ACV’s private market investors have provided the company with $394MM in pre-IPO funding across eight rounds of financing at an average price per share of $2.87. This should be instructive to early-stage marketplace founders when thinking about how many financing rounds may be necessary to achieve the goal of a standalone publicly-traded company. Marketplaces can take longer to get going than traditional SaaS businesses, which is evidenced by how much of ACV’s share price appreciation occurred in only the last 2-3 years.
ACV Financing History

As of the IPO, ACV’s largest shareholders are Bessemer Venture Partners (28.9%), Tribeca Venture Partners (11.9%), SoftBank (7.1%) and Armory Square Ventures (5.7%), accounting for a combined 48% pre-IPO stake in the firm.
We are looking forward to following ACV’s growth in the coming years and will be continuing to break down B2B marketplace S-1’s as more and more marketplaces reach public company scale. Special thanks to Pat McGovern for his contributions to this post.
If you liked “S-1 Teardown: ACV Auctions” and want to read more content from the Bowery Capital Team, check out other relevant posts from the Bowery Capital Blog. Look out for more content on B2B Marketplaces from us in the coming weeks.


