

Every year, several of our investors (Limited Partners) invite us to their annual meetings. The talk track is generally about prior year results and performance, trends, themes, and the future. It is always a fun ritual and a great way to compare notes. One of the common themes we see in these meetings is the presentation of underlying portfolio data. We thought it would be fun and informational to share one of the best presentations we have seen this year on the state of the market from our friends at Cendana Capital. They have been great partners to our firm and are invested in many well-known pre-seed and seed managers. Below are some slides and trends we found interesting as well as some color commentary from me and Kelli Fontaine. The data is based on 103 funds run by 62 firms and includes 2,255 companies that make up the full Cendana Capital portfolio.
Valuations Increasing…But Mostly Post-Seed.

MB: Since Jan 2012 when they started tracking the data until June 2021, the average change in post-money valuation has been 239%. Pre-Seed and seed are up 114% and 99% respectively. Given the market movement and amount of competition, this seems logical. If you look at the data just from Jan 2019 until June 2021, the average change has been 69%. Most of the shift has been at Series B (125% increase since Jan 2019) and Series C (159% increase since Jan 2019). It is nice to have some numbers showcasing these changes and confirming what everyone has been seeing at the later stages in the market.
KF: The changes at the early stage seem modest when looking at the financing paths of companies. The post-money valuations are a result of two factors; the round size and founder dilution. We have seen the later stage round sizes increase more dramatically, with war chest rounds, and at the Series B and C, the founders are able to command roughly half the amount of dilution as they did in 2012.
Pre-Seed Valuations At $6MM & Seed Valuations At $15MM.
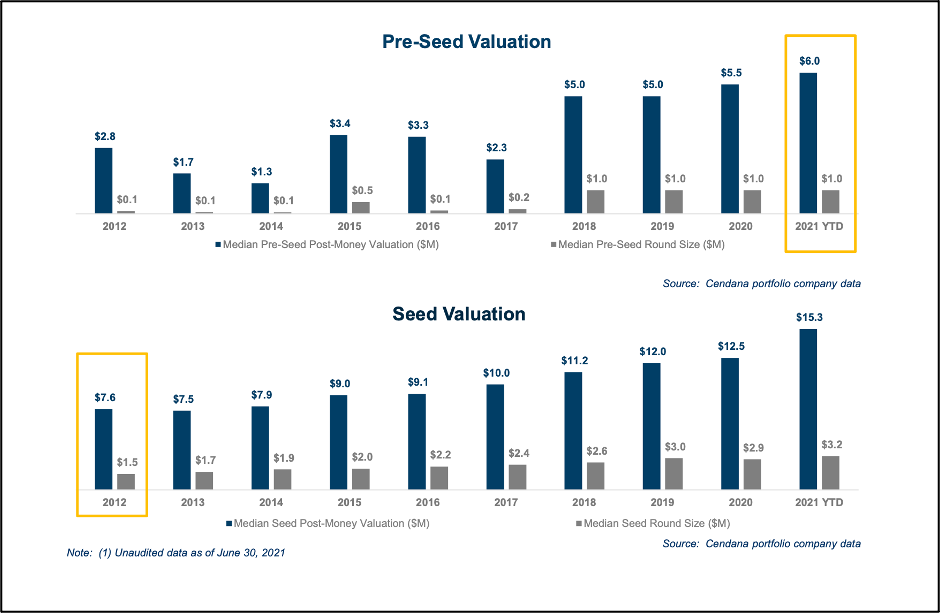
MB: One of the better datasets that Cendana Capital tracks is pre-seed and seed valuations over their entire portfolio. Looking at the data, Pre-Seed rounds have grown from $2.8MM median pre-money to now $6.0MM. Seed was at $7.6MM median in 2012 and is now at $15.3MM in 2021. A roughly 2x increase in both numbers with Pre-Seed valuations now approaching 2012 Seed valuations. Perhaps more surprising is that round sizes for Pre-Seed have not really changed, while they have basically doubled for Seed. While not in this chart, the $4MM Seed round is moving towards a majority. The Cendana dataset shows that 36% of rounds led by their portfolio funds in 2021 were over $4MM (up from 6% in 2012 and 23% last year). Also note the huge jump in Pre-Seed valuations from 2017 to 2018 and then the steady rise in Seed and 2020 to 2021 bump in valuation. Are these levels the new normal?
KF: Important context to add when looking at the evolution of Seed is the traction of the underlying companies. In 2021, the average company raising a Series Seed round has been around for 3 years. In 2014, the average age of a company raising a Series A round was 3 years. The traction of the companies is allowing them to earn larger rounds and valuations at the Series Seed stage.
Series B Valuations Are Now At 2019 Series C Levels.
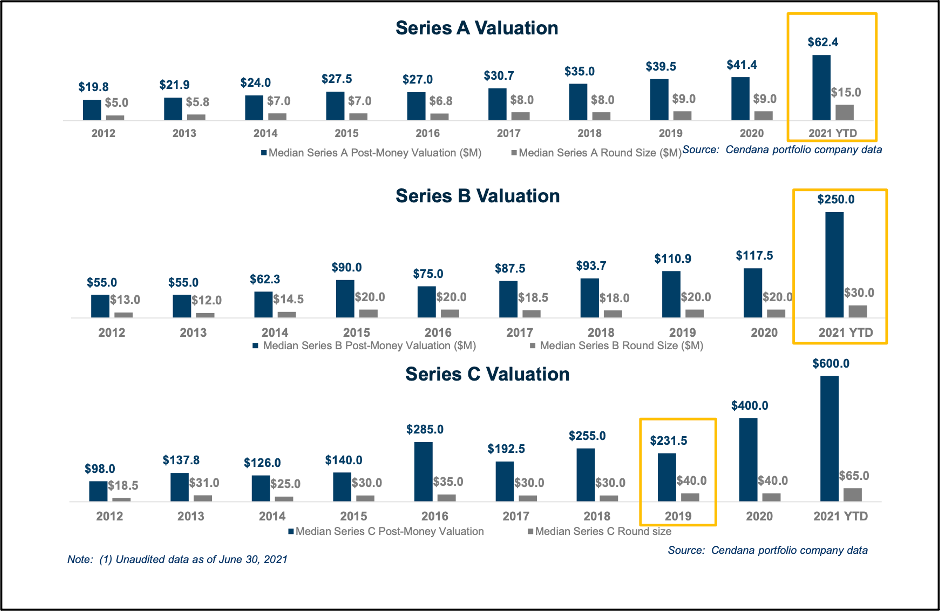
MB: Another great dataset that Cendana Capital tracks which has been helpful to our founders are follow-on financings. Looking at the data, we are seeing 300-600% increases in median pre-money valuations for Series A, Series B, and Series C since the dataset begins in 2012. The median Series A is now at $62MM up from $41MM just a year ago. Series A and Series C valuations are up 1.5x from last year while Series B is up over 2x from the 2020 data. Series A and Series B valuations kind of bump along from 2012 through 2020 where we see a pretty large change this year. For Series C, it seems like the major shift happened in 2020 but we are continuing to see huge jumps this year.
KF: The data behind this is complete with over 100 financings in each vintage. Notably, the data includes 338 follow-on financings in the portfolio in 2020 and through Q2 2021 there were already over 400 financings in our data set. Showing the 2021 bumps in valuations are not outliers but the trend.
If you liked “2021 State of the Seed: Everything Continues To Blossom.” and want to read more content from the Bowery Capital Team, check out other relevant posts from the Bowery Capital Blog.


